risk manager
for power transmission line areas
for power transmission line areas
This project was developed under the Aneel P&D Program, an initiative by the Brazilian Electricity Regulatory Agency (Aneel) that fosters research and development in the energy sector.
The project was carried out for CPFL Energia, one of Brazil’s largest electricity companies, responsible for power generation, distribution, and commercialization.
I worked on this project as a UX/UI Designer and UX Researcher for GIScaruso, a geospatial intelligence company within the Caruso Group, which specializes in environmental and technological solutions.
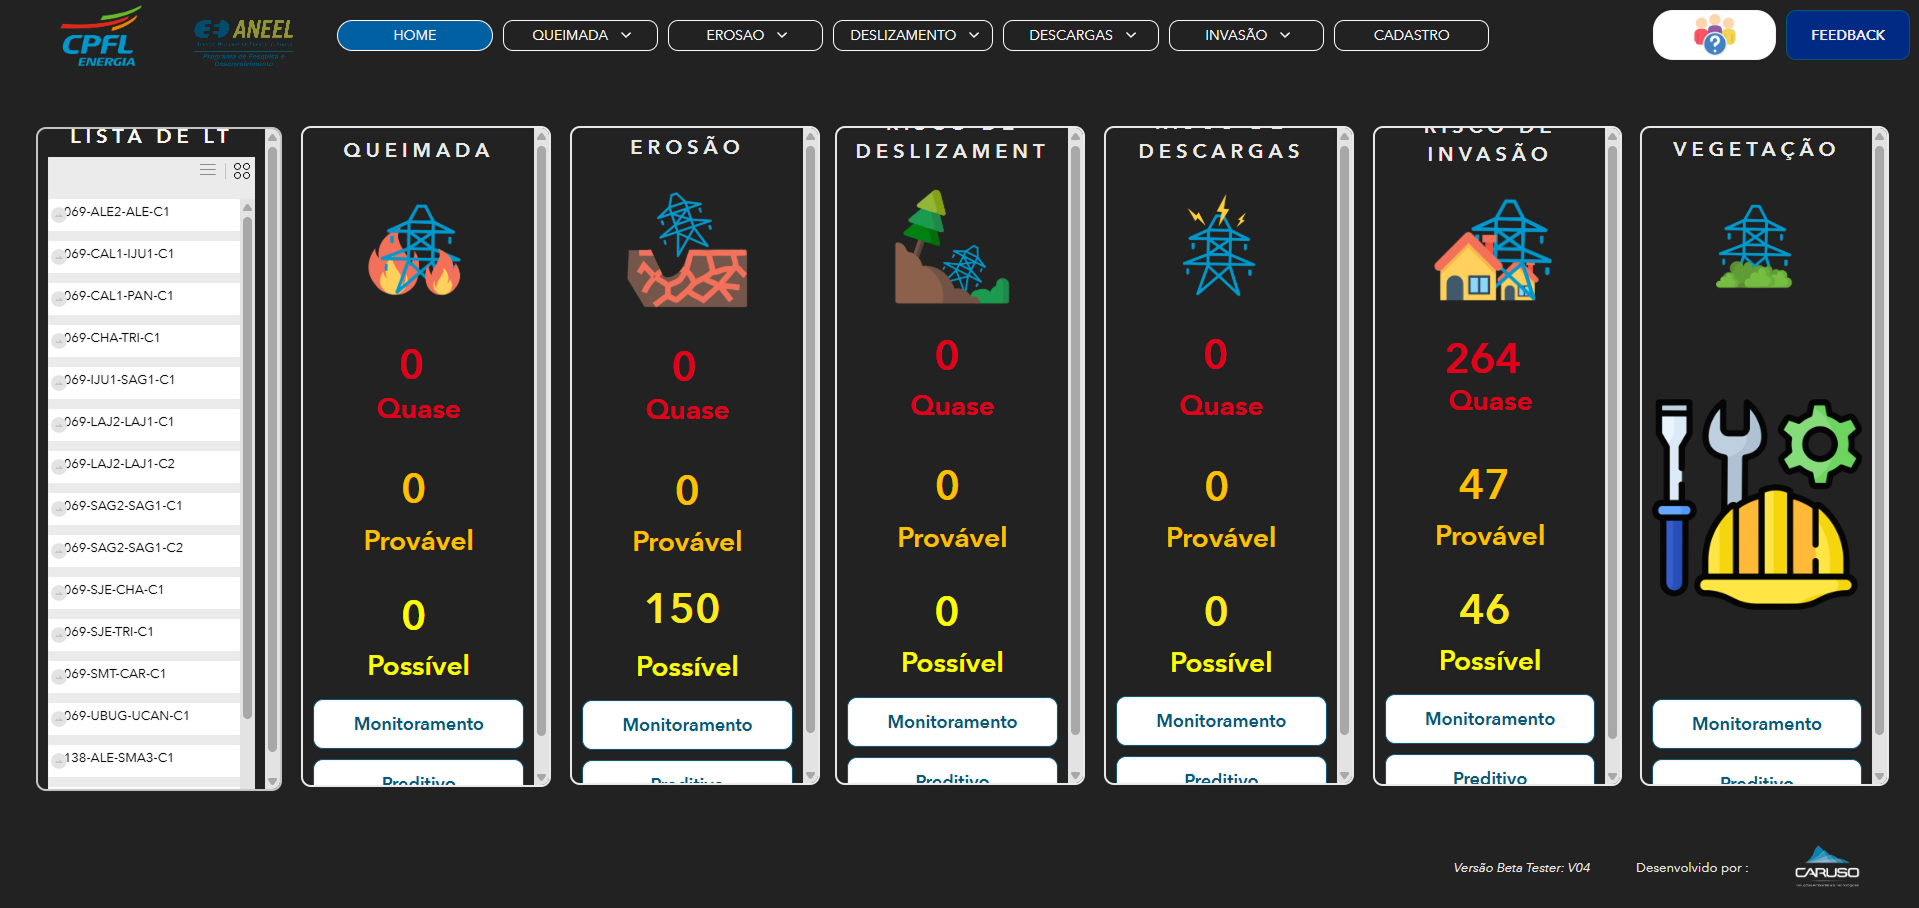
The system is a dashboard that monitors and predicts risks in power transmission line areas across Brazil, providing real-time insights through multiple risk modules:
Wildfires – Detecting and assessing fire risks near transmission lines.
Erosion – Identifying soil degradation that could compromise infrastructure.
Landslides – Monitoring areas prone to ground displacement.
Lightning Strikes – Predicting and analyzing lightning-related hazards.
Anthropic Invasion – Detecting human activity and unauthorized constructions.
Vegetation Growth – Assessing the impact of vegetation on transmission lines.
My contributions to the project:
UX Research – Conducted user interviews and gathered feedback to understand their needs and challenges.
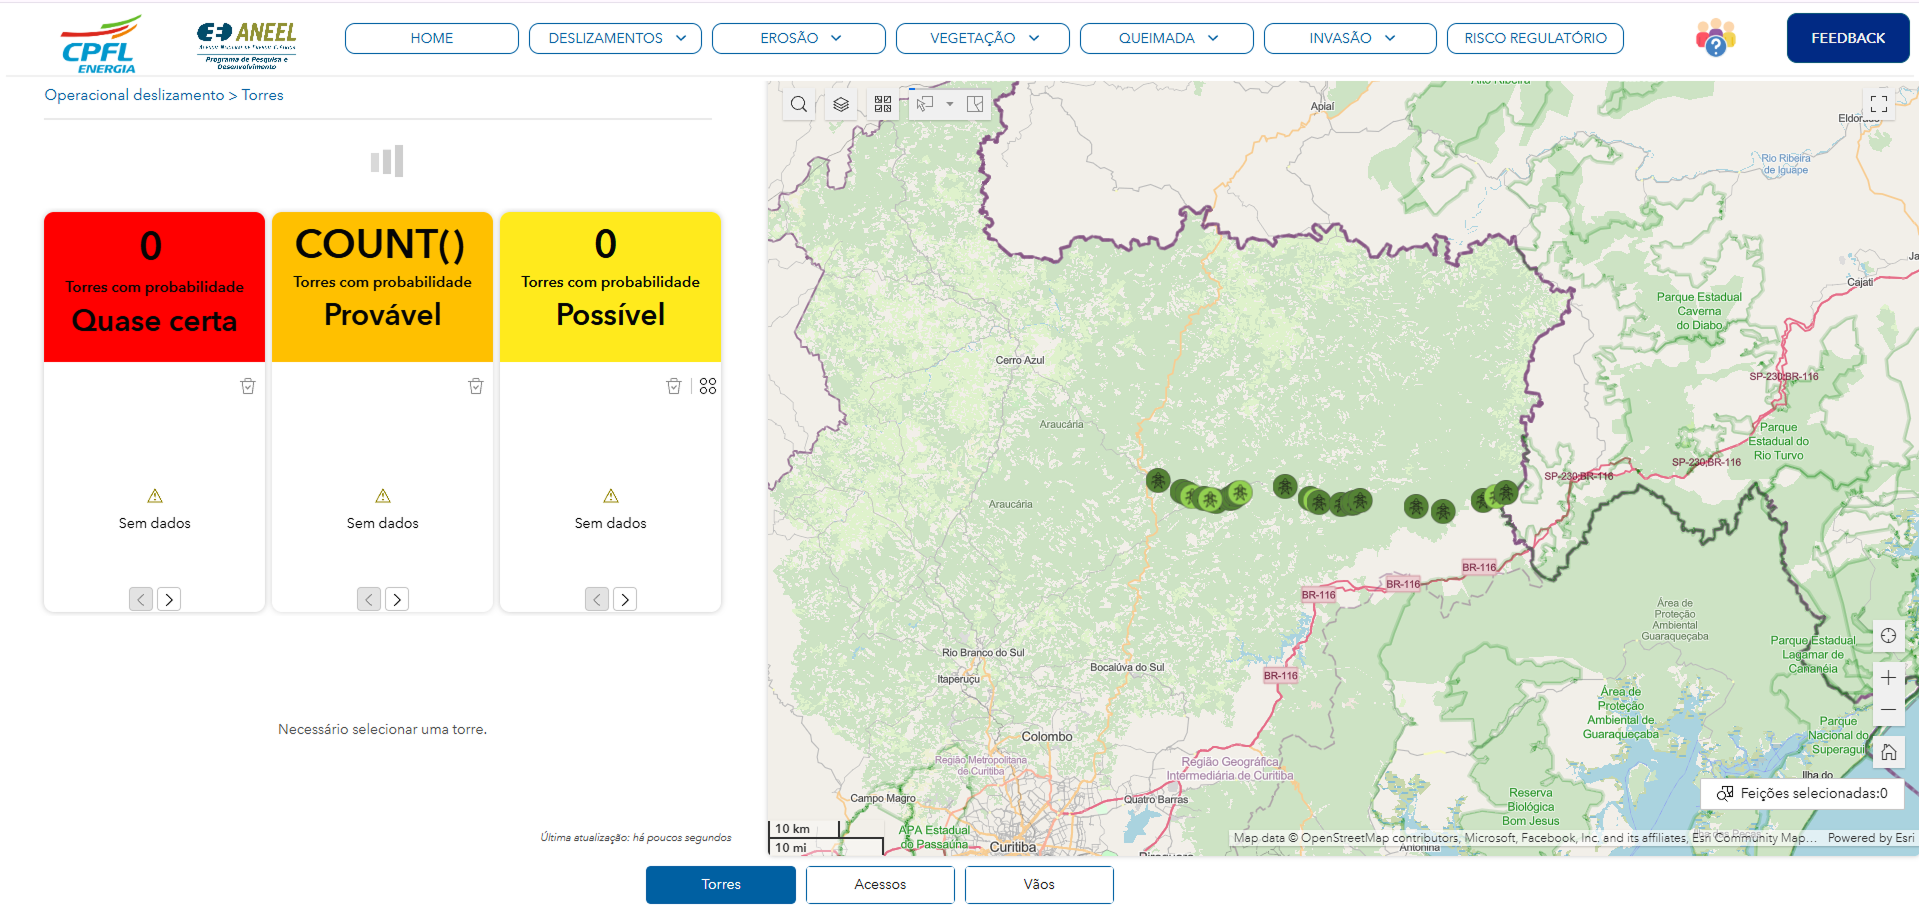
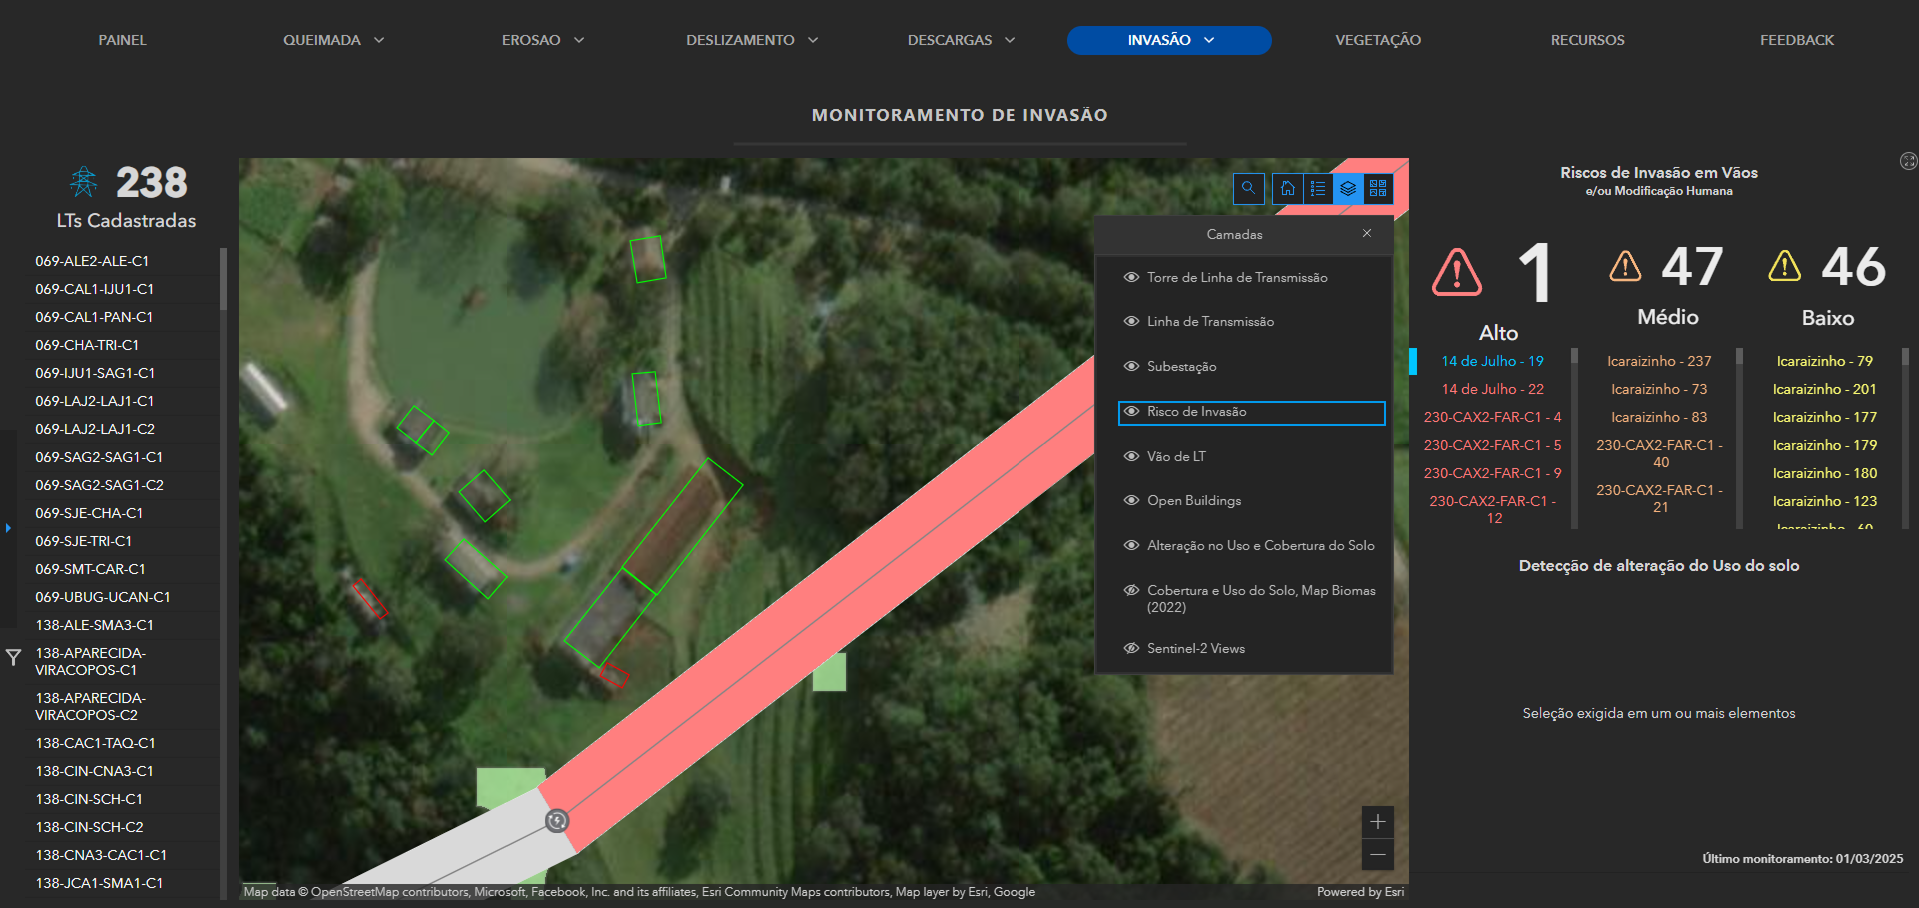
UI Redesign – Restructured the system’s interface, making it more intuitive and efficient.
Tools used: Figma, Esri - Experience Builder and Map Builder, Prompt for Frontend - HTML, CSS, and JavaScript - Adaptations were made in the prompt using HTML and CSS.
Software Testing – Performed usability tests to identify pain points and validate improvements.
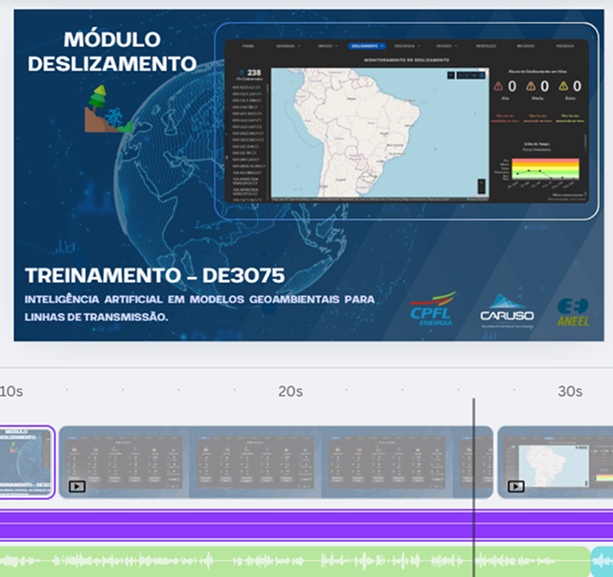
Tutorial Videos – Created instructional videos to guide users on how to navigate and utilize the software effectively.
My work ensured that the system became more accessible, functional, and aligned with the users' needs, helping CPFL better manage risks and maintain the reliability of power transmission in Brazil
before
after

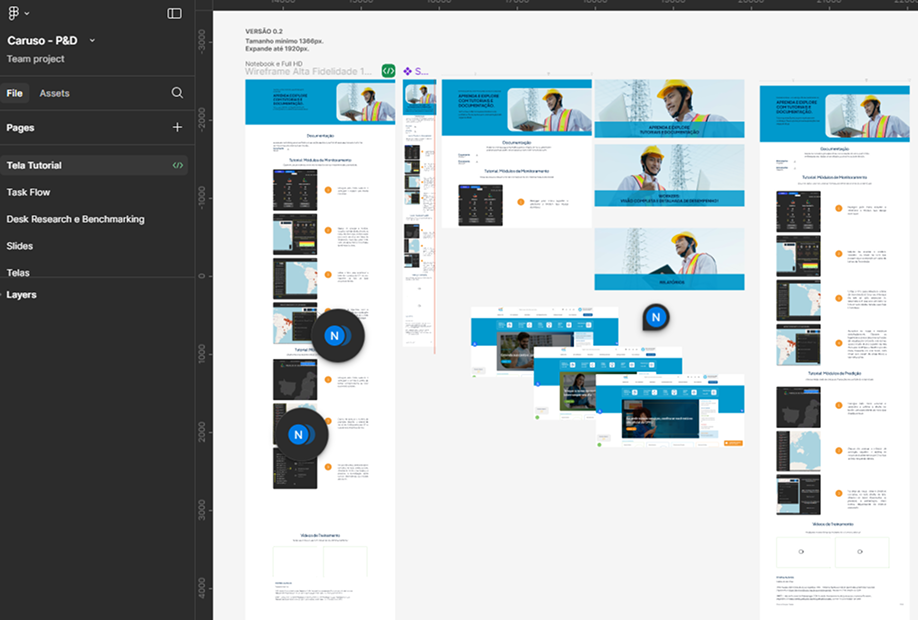
Work station:
work Organization and creation of tutorial pages in the software, as well as tutorial videos.
Data & Results - Impact of the Implemented Improvements:
Based on the usability tests conducted on the DE3075 software, the following advancements were achieved:
Enhanced interface and navigation, reducing difficulties reported by 35% of users.
Creation of an interactive tutorial and accessible documentation, eliminating the need for additional support for 100% of tested users.
Improved organization of information and usability of graphs, reducing confusion and facilitating decision-making.
increased user satisfaction, with the average rating rising from 3.82 to 4.00 out of 5.00 after the second user experience, despite the software operating in an environment with limited UX/UI tools.
conclusion
By applying UX Research, UI Design, and usability testing, I contributed to making the DE3075 risk management software more intuitive, efficient, and user-friendly. The improvements in navigation, data visualization, and user guidance significantly reduced friction points and increased overall satisfaction.
Additionally, the creation of interactive tutorials, documentation, and instructional videos empowered users to navigate the platform independently, eliminating the need for extra support.
This project reinforced my expertise in designing data-driven dashboards, conducting usability testing, and optimizing complex systems, ensuring better decision-making and operational efficiency for companies in the energy sector.
